This example creates a data graph by the usage of irregular data. 1. Click 2. In Data Edittor, select Irregular Data item from Data Type combo box, input 5 in Points field, click OK button, and input other values according to the following figure. Visual Data Pro will use the data of 5 given points to generate a regular gridded data, the size of the gridded data is 41*29, the range of data is -10<=x<=10, -7<=y<=7.
3. Click
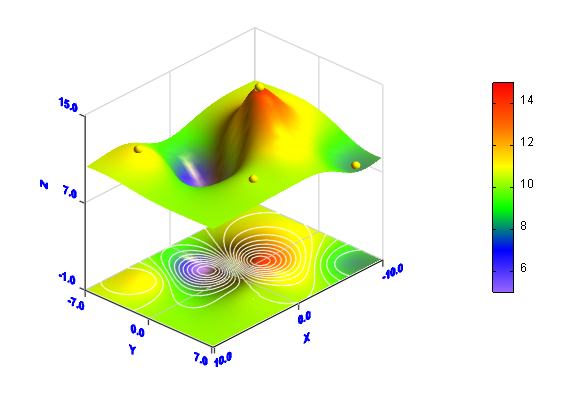
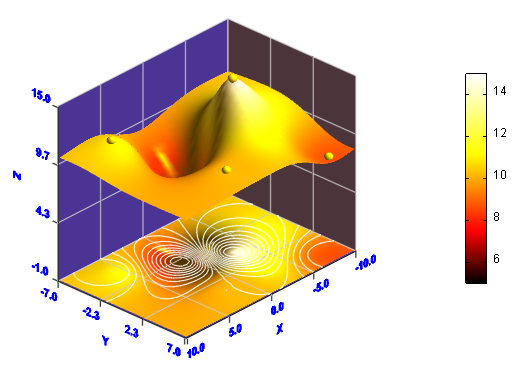
Click OK button to create the graph. The yellow spheres show the positions of the 5 given points.
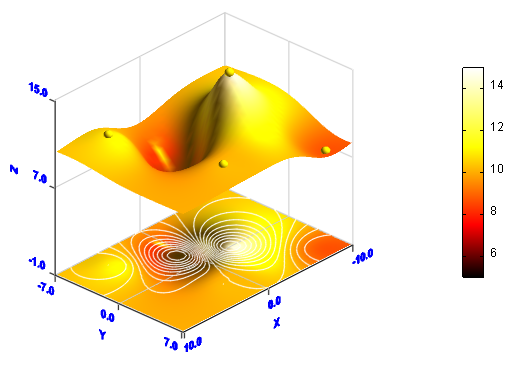
4. Right click the item corresponding to the graph in Graph Manager, then click Edit... item in the popup menu to open 3D Surface Properties dialog box again. Click Color tab, modify the colormap to "hot".. Click OK button to modify the colors of the graph.
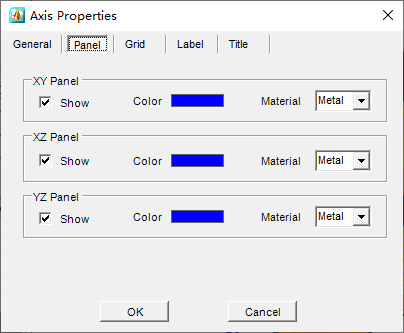
5. You can also modify the properties of the axes. Click
Click OK button to get a new look.
|
|||
Download Visual Data today and start creating stunning scientific visualizations for your research and analysis.

 button.
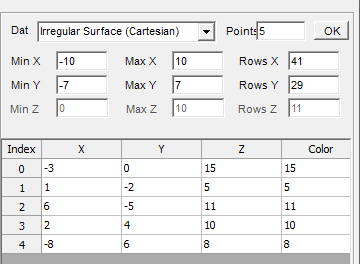
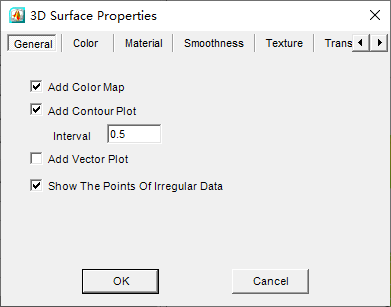
 button in Standard toolbar to open 3D Surface Properties dialogbox. Check Add Color Map checkbox and Add Contour Plot checkbox, input 0.5 in Interval textbox. Check Show The Points Of Irregular Data checkbox.